Abstract
The aim of this topic is to consider patterns and trends in (net) immigration to the UK. The material in Hatton (2005) on the reading list has some useful information in the early sections about this and Clark and Drinkwater (2008) has some information about more recent years. Feel free to read more widely and add in other relevant information. Try to distinguish between labour and non-labour migration and distinguish between the sources of different groups of immigrants, the destinations of emigrants and any characteristics of migrants which might relate to their human capital etc. and hence their labour market outcomes. How has policy potentially been important?
Hatton (2005) also develops a theoretical model based on the Borjas and Roy models of immigration to try and explain the patterns of immigration to the UK. He then tests this model using data from the International Passenger Survey. Your job in this topic is to outline and explain the theoretical model and then discuss the empirical results and see how well the model explains patterns of immigration. On the theoretical side, try to give a clear intuition of how the model works (this is not easy with respect to the inequality stuff but please do the best you can - we will come back to it in the feedback session). On the empirical side, briefly outline Hatton's modelling strategy, where his data come from then focus on carefully explaining the results
in Table 5 and Table 8. Compare Hatton's model with the human capital and Borjas models that we discussed in lectures.
Can you find any other theories of migration (e.g. sociological) which can be contrasted to the Hatton-Borjas type of approach?
University of Manchester website
DEFINITIONS
Migration - is defined as the movement of people from one country or locality to another. It can be thought of as an investment. Migrants are defined in the International Passenger Survey as those who are entering (or leaving) for an intended period of at least a year, having spent at least a year abroad (or in Britain))[2.1.1].
Emigration - can be defined as migration from your native country in order to settle in another.
Net Immigration - is the difference of immigrants and emigrants of an area in a period of time, divided (usually) per 1,000 inhabitants (considered on midterm population). A positive value represents more people entering the country than leaving it, while a negative value mean more people leaving than entering it.
OVERVIEW
There was relatively little migration into Britain (other than from Ireland) until New Commonwealth immigration began in the 1950s. Legislation in the early 1970s was intended to reduce this to a trickle. In practice it continued at the rate of half a million acceptances for settlement every decade. The UK has gone from being a country of net emigration to one of net immigration since 1970s. During the 1960s & 1970s emigration was greater than immigration, and therefore net immigration was persistently negative.
When the Second World War ended in 1945, it was quickly recognized that the reconstruction of the British economy required a large influx of immigrant labour. "The Royal Commission on Population" reported in 1949 that immigrants of 'good stock' would be welcomed without reserve, and potential newcomers from the Caribbean and elsewhere soon became aware of the pressing needs of the labour market in the UK".[2.1.2].
Postwar immigration also attracted, for the first time, large numbers of workers and their families from outside Europe - mainly from the Caribbean and from India and Pakistan, the two separate states created by 'partition' after Britain relinquished its Indian empire in 1947. During the 1950s, in particular, Britain's non-white immigrant population increased rapidly in size.For decades British multicultural policies have mainly centered on fewer communities, mainly Asian and African-Caribbean. In the eyes of policymakers, these were the people who generally comprised Britain's immigrants. But the new data shows how, compared with these patterns from the 1950s-1970s, immigration to Britain between 1991-2001 involved people from a wide range of countries beyond the New Commonwealth nations that traditionally provided the main sources for migration to the UK.
This page will go on to show general immigration trends using; the Human Capital Model, the Borjas model and the Hatton model to explain immigration trends. The impact of the European Union (EU) enlargement on UK migration will also be discussed. Other theories - such as socialogical theories - will also be discussed.
General Trends:
Migration is not a one-way street. There is also substantial emigration from the UK. For almost 20 years from the early 1960s the UK was losing more people abroad than it was gaining from immigration - many of whom answered a call to start a new life in Australia. But the numbers are now declining compared to that of those migrating to the UK. As the graph below has shown:

**Source:Office of National Statistics**[2.1.3].
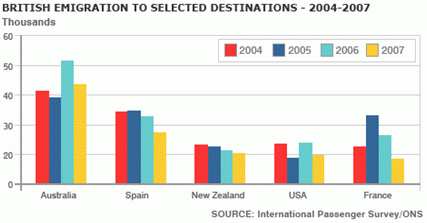
British people still leave - and the favoured destinations remain English-speaking destinations, plus Spain and France. Below is a Chart showing the most favoured destinations of British migrants and the total number of British citizens emigrating in particular year:
*Source:International passenger survey/ONS*[2.1.4].
This chart shows that the most popular destination for British emigrants is Australia with a total of 52,000 British emigrating there in 2006 alone. Following closely are Spain, then France, USA and New Zealand.
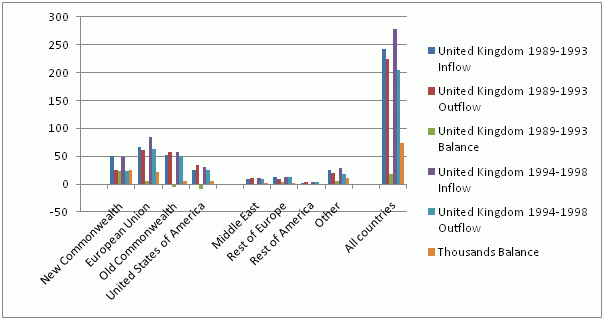
The pattern of people entering and leaving the United Kingdom changed over the 20th century. There was a net loss due to international migration during the first three decades of the 20th century and again during the 1960s and 1970s. However, since 1983 there has been net migration into the United Kingdom. Over the period 1994 to 1998, net international migration to the United Kingdom averaged 73 thousand a year.
_Source: Office of National Statistics_[2.1.5].
Between 1994 and 1998, 17.5 thousand more people per year migrated to the United Kingdom from the EU than between 1989 and 1993, compared with 17.6 thousand more from all other regions. Of those migrating from the United Kingdom to other countries between 1994 and 1998, most were leaving for the EU or Old Commonwealth countries, such as Canada, Australia and New Zealand.
Over the past decade migration into the country increased from 314,000 in 1994 to 582,000 in 2004, with most of the increase to inflows occurring after 1997. Out-migration increased more quickly than inflows but to a lesser extent, from 238,000 in 1994 to 360,000 in 2004. Migration is generally most common among younger adult age groups.

**Source: Brtish broadcasting commission(BBC)**[2.1.6].
The pie chart above shows that labour migration is one of the main reasons for foreigners migrating to the UK, with 30% of migrants coming to start a new job, and 12% hoping to find a job. We could also assume that out of the 26% of students who are coming to study in the UK, a certain percentage of that group will eventually take up jobs in the UK, as studying in the UK gives foreigners 'passport' to the British labour market. Education entrants tend to do much better in terms of employment and earnings. This could be a reason as to why there is a high volume of students coming to study in the UK. The British universities have expanded massively in recent years to take in foreign students because they pay full course fees, playing an important role in the economics of higher education.
From the pie chart, it is evident that Non-labour migration tends to be more amongst the UK citizens emigrating from the UK to other countries, with a total of 45% of people emigrating out of the UK for reasons other than work related. On the other hand, 32% of immigration to the UK is Non-labour related
Recent Trends [2.1.7]
A more recent study of migration trends can be found in Clark/Drinkwater (2008). This is of particular interest as it documents the period of EU enlargement in 2004 when the A8 countries could move more freely in and out of the UK. The A8 included the Czech Republic, Hungary, Estonia, Latvia, Lithuania, Poland, Slovakia and Slovenia. A census in 2001 showed a dramatic increase in immigrants from the new commonwealth (a third of 4.9 milion immigrants from Asia) and this figure only got larger after 2004.

The above graph taken from the Total International Migration (TIM) estimates produced by the Office for National Statistics shows inflows to the UK over the period 1991-2006. The estimates are based on responses to International Passenger Survey which consists of 250,000 interviews (around 0.2 percent of all travellers' including British citizens). TIM estimates include all categories of migrants, even students and those rejoining their families. However, it does tend to underestimate migration as it only captures those intending to stay for more than a year while many recent migrations to the UK were on a temporary or circular basis. This is highlighted in the A8 data from the graph which suggests only 92,000 people from these countries entered the UK in 2006. Other sources suggest a much larger number. For instance if we look at the below table which
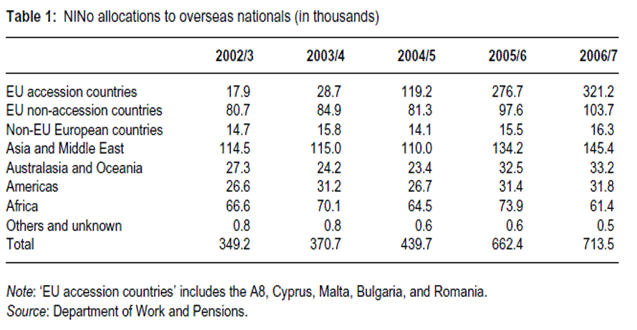
shows new allocation of Nation Insurance Numbers to overseas nationals (this is needed to work). The number of allocations to EU accession countries doubled in less than 5 years from 350,000 (2002/3) to 700,000 (2006/7). From this data we can deduce that after the EU enlargement in 2004 there were massive increases in National insurance number allocation to the newly joined A8 countries (increases to around 320,000 in 2006/7). This gives us a clearer view on the effect the enlargement had on immigration, specifically those coming to the UK looking for work. Of all the A8 countries it was the Polish whose numbers were the most substancial with over 30% of new allocations in 2006/7 made to poles accounting for 222,760.

Another source of migration info is the Workers Registration Scheme (WRS), established following the EU enlargement to the A8 countries in 2004. A8 workers are supposed to register within a month of starting work in UK; however this is not compulsory which creates underestimates. From this graph above we can see the general growth in polish population up until 2006 where it starts to recede. This could be caused by a number of factors such as a more buoyant domestic labour market and strengthening of Polish zloty against the pound. This graph also clearly shows the seasonal element to Polish migration with high levels of registration usually recorded in the second and third quarters and lower levels in the first and fourth. This is true of the other A8 nationals as well. The WRS further tells us the extend of migrants stays with 59% in 2007 only intending to stay for less than 3 months, 8% for over 2 years while 25% were unsure.

Another useful source of immigrations data is from the Labour Force Survey (LFS). This is a nationally representative survey conducted on a quarterly basis with a sample of around 60,000 house holds every quarter. Each household taking part remains in the sample for five waves. Cons to this survey are that the sample is a relatively small number of recent migrants and as a result is thought to undersample, especially those who don't stay very long. However it does include migrants from all countries and covers a wide variety of questions. The above table taken from Clark/Drinkwater was compiled from the first wave and allows us to look at different trends between UK born and recent migrants before and after the enlargement.
The first thing to notice is the employment rate rise for recent migrants by nearly 10% between the two period while the UK born rate only rose slightly. This is due to the A8 enlargement which occured in the second period bringing in lots of new immigrants. Unemployment remains relatively unchanged over the periods and as does self employment, although table does show us that there is a relatively low self employment rate in recent migrants compared to UK born. Recent migrants are more than 4 times more likely to hold temporary jobs than UK born despite a fall in the percentage in the later cohort.
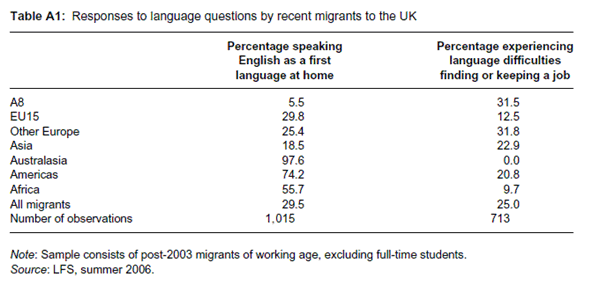
In industry percentages there is a large increase in recent migrants working in manufacturing which is clearly due to A8 enlargement. The effect is also felt in the occupation percentages which sees the number of recent migrants in managerial/professional positions fall in the second period. Once again this is explained by the A8 counties who despite having high levels of educations have filled many of the low skilled sector work. This has resulted in a drop in the mean wage between the two periods (£3), however before the enlargement recent migrants had a higher mean wage than the UK born. The language barrier definately creates a big hindrance to migrants obtaining much better than low level jobs. Below is a table also taken from the LFS corresponding to specific years where questions about language were included in the survey. It suggests that around 70% of recent migrants speak languages other than English as first language at home. There is big variations between regions with 94% of people from A8 countries not having English as a first languaged compared to 2% from australasia. The average for migrants finding the language barrier a problem to their work prospects is 25% and we can see this is most likely the cause of the big increase in migrants working in jobs like manufacturing where speaking is not really required.
Characteristics and Labour Market Outcomes of the Migrant and UK-born Population
The foreign-born population comprise an important part of UK labour market .The analysis in the above report clearly shows that the foreign-born population in the UK is not a single homogeneous group. Their experiences in the labour market vary considerably with some groups enjoying more success than others.Migrants tend to be of working age, and particularly concentrated in the ages of 25 - 49. Among those of working age, about half of the foreign-born are female (49%), similar to that of the UK-born (47%).
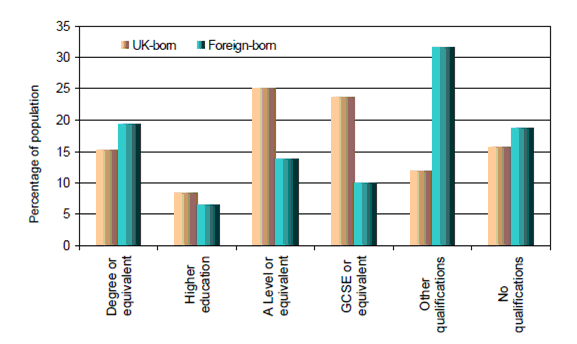
Figure1 Qualification levels
*source: Russel Haque(2002),Home Office[2.2.1].
The foreign-born population is concentrated at both the low and high end of the skills distribution.
The foreign born are more likely to be highly qualified, with 19 per cent of working age people holding degrees,compared to 15 per cent among the UK-born.However, a greater proportion among the foreign-born also have no qualifications (19% compared to 16%),Notably also, a much greater proportion among the foreign-born have Other (or unnamed) qualifications5 (32% compared to 12% among the UK-born). It appears that there are a large number of migrants who may have GCSE or A Level standard qualifications but, because their qualifications are from abroad and may not be easily comparable to the UK system, they are consequently not being recognised.
Figure2 Employment Rate

*source: Russel Haque(2002),Home Office[2.2.1].
Migrants generally fair worse than the UK-born in terms of participating in the labour market and finding work. The employment rate among migrants is around 64 per cent, compared to around 75 per cent for the UK-born. But there are substantial variations in labour market experience as well.The employment rate of women (64%) is about 13 percentage points lower than that of men (77%) among the UK-born. Among the foreign-born the gap is larger, at about 16 percentage points (68% for men compared to 52% for women). It is particularly large among those from the Indian sub-continent and particularly small among those from Eastern Europe, Australasia and the EU .While the overall UK employment rate has been steadily on the rise since the early 90s,so too has that of the foreign-born. In fact, the gap of 11 percentage points has been virtually unchanged over this period. This suggests that the labour market performance of migrants has at least not deteriorated in comparison.
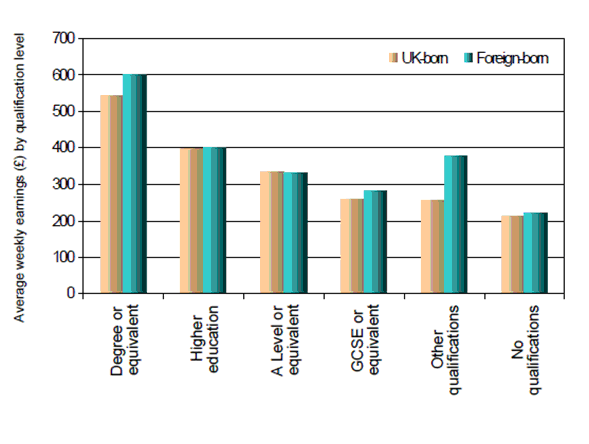
Figure3. Earnings and Educational Qualification
*source: Russel Haque(2002),Home office[2.2.1].
The chances of finding work are evidently better for those with english speaking backgrounds.
This employment disadvantage for migrants exists consistently at all qualification levels.
Both the highly-skilled and low-skilled have difficulties competing for jobs with their UK born counterparts, although the gap is generally larger at the lower skill levels.
Earnings at different skill levels are also higher, or at least equivalent, for migrants compared to the UK-born. At the high skill end (proxied by those with a degree qualification), migrants earn £601 per week compared to £543 p/w for the UK-born (that is, about 11% more). At lower skill levels, for instance among those with GCSE level qualifications, migrants earn £281 compared to £259 (about 8% more). The difference is even larger among those with unnamed qualifications - £378 compared with £255 (48% more).
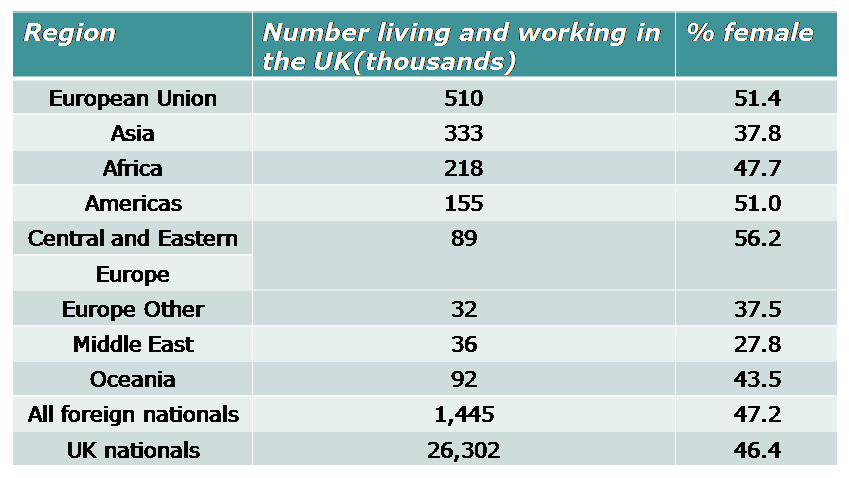
Gendered data..
** source*: Salt J(2004),report of the United kingdom SOPEMI correspondent to OECD[2.2.2].
The female percentages of workers from central, eastern europe ,americans are nearly half of their poplulation.The percentage of Middle east is relatively lower than other migrants from other countries.
Source:Salt J (2004)
ower-skill levels.
The Human Capital Model
Like all human capital investments, migration decisions are based on the comparison of the present value (PV) of lifetime earnings in all available employment opportunities. It is also partly based on the Hatton model with a few similarities in respect with using relative income to calculate the present value and also taking into account the costs acquired from migrating.
Take this following example into consideration:
Suppose a 20 year old individual, working in London decided he/she had a job opportunity abroad in Paris
Let;
PV(LDN) = PV of worker staying in London
PV (PAR) = PV of worker moving to Paris
r = The discount rate
M = Migration costs
Then;
He/she is currently earning W²⁰(LDN).
If they were to migrate they would be earning W²⁰(PAR) with migration costs of M.
Therefore, if they were to stay in London their present value would be:

And if the worker were to move to Paris their present value would be:

[3.1].
This formula acts as though the worker is going to work on forever but at this point the individual would decide on a retirement age and then add all possible income values for each year, making sure they take the discount rate into account for both options. The total sum would give him/her their present value of working both in London and Paris to give them a wider scope of their relative income receivable. However, they must remember to take their migration costs into account as well.
With the present values and migration costs at hand, the individual can also realise their net gains to migration:
Net Gains to Migration = PV(PAR) - PV(LDN) - M
If the Net Gain to Migration is Negative, and PV(PAR) - M < PV(LDN) ,
it would not be worthwhile to move abroad and he/she stays put.
If the Net Gain to Migration is Positive, and PV(PAR) - M > PV(LDN) ,
it would definetly be in the inerest of him/her to migrate.
Aside using PV values, a number of propositions follow from this framework:
1) An improvement in economic opportunities (i.e unemployment rate, lower tax rate) available in destination country increases net gains to migration, increasing probability of migration and vice versa.
2) An improvement in wages in destination country and the possibility of a higher income would increase the probability of migration and vice versa.
3) Increase in migration costs (M) lowers net gains to migration, reducing probability of migration.
4) Higher discount rate (r) lowers net gains to migration, reducing probability of migration and vice versa
Therefore, migration only occurs when the worker will recoup his/her investment. [3.2].
The Human Capital framework indicated that a worker is indifferent between moving and staying if the discounted net gains from moving are equal to the migration costs, M.
Examples of such Migration costs include:
1) Expenditure occurred in transporting worker and family
e.g Airfares, cost of moving household belongings
2) Psychic costs
e.g Pain and suffering of moving away from friends, family and social circle
3) Currency costs
e.g Cost of living may increase/ decrease
These costs are indicated in the following equation:

,where we are using Warsaw, Poland as host country
For us to understand the size of M in order to make the worker indifferent, we need to know the average annual wage of both countries and then divide the whole equation by W(WAR)
M/W(WAR) is defined as π- proportion of workers salary in Poland spent on M.
Thus;

Here is another example for us to consider:
Suppose,
Average wage in the UK is £50,000 and
Average wage in Poland is £24,000
The discount rate is 5%
So the ratio ![]() is calculated to be (50000-24000)/2400 = 1.08
is calculated to be (50000-24000)/2400 = 1.08
This indicates that by migrating to the UK, the worker will increase his/ her income by 108%
Taking the discounted rate into account, the value of the LHS becomes 22.7
Therefore, knowing π is the proportion of workers salary in Poland spent on M, M for a worker who is indifferent between staying at home or migrating to the UK is nearly 23 times his salary.
Here, the human capital model suggests that even though wages in the target country are over 2 times then domestic ones, the M are too high to migrate.
Borjas Model(1987):
Borjas' Model is used widely and based on the Roy Model. It is assumed that individuals compare the potential incomes in the United States with the income in the home countries, and make the migration decision based on these income differentials (net of mobility costs)[4.1]. He also suggested that the workers from lower wage countries will immigrate. Borjas model aims to answer; who has the biggest incentive to migrate to the USA? (Is the skilled or unskilled?) and focusing on the average "quality "of the immigration flow rather than applied to the "quantity" of immigration or emigration.
Specifically, the quality of immigrations depends entirely on the relationship between wages and skills for each of the countries. Thus there are no migration costs. However, Hatton's Model,introduced in the next section, illustrates that the quantity of migrants is based on the effects of relative incomes, income inequality and immigration policy. In the Borjas Model, it is suggested that the individual faces a "self-selected" situation where they have to make an optimising decision. Immigrants are either positive selected or negative selected.
Migration " self-selected"
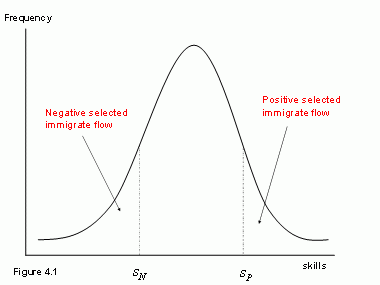
These two quality differential migration decisions can be explained more specifically in the following graphs:

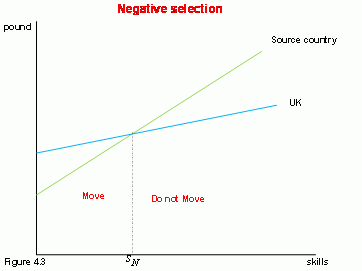
In the case of positive selection, individuals will migrate to the UK if they are in the skill distribution which is higher than Sp. those therefore those with higher skills leave their country of origin and they outperform the native population when they get to the UK.
In the case of negative selection "workers with fewer than SN efficiency units will gain a higher payoff in the UK and will have an incentive to move. In contrast, workers who have more than SN efficiency units have higher earnings in their source country and will not emigrate."[4.2] Therefore the migrant flow will be composing of the least-skilled workers.
Hatton's Model(2005):
This model is formally based on the on the Borjas and Roy models of immigration. It is assumed that the numbers of migrants are based on the effects of relative incomes, income inequality and immigration policy. More specifically, the probability of a migration decision is determined by these factors. Hatton notes that the relative income is the difference in income between the source country and the destination country, and the income inequality is the income difference within the destination country. It also assumes that an individual will only migrate from their source country to the UK.
From a more general perspective, the factors of relative incomes, inequality and immigration policy are able to be grouped into two categories, the Income category and the Cost category.
- Income: Suppose there are two countries: the destination country ( x ) and the source country ( y ) . If residents of the source country ( y ) were migrating to the destination country ( x ) , they would face some income functions that which are distributed as:
Income in destination: Wxi=αx+βx si,distributed as Wx~N(µx,σ²x),
Income in origin: Wyi=αy+βy si, distributed as Wy~N(µy,σ²y),
Where αx,βx and αy,βy are the parameters of the respective earnings functions and the si follows a normal distribution:sx~N(µs,σ²s). β is the parameter of return on skills. The higher the β, the greater the return on skills. It also indicates a country's income inequality. Here we assume that βx≠βy so income levels and income inequality should be different between the destination country and the source country, but Hatton notes that if residents have a higher income level in y, they should also have a higher income level in x once they have migrated. - Cost: The migrant also faces three important elements of costs:
1. Individual-specific cost or compensating Zi with a normal distribution Zx~N(uz,σ²z), and is assumed to be positive.
2. The direct cost, c which is the fixed cost faced by all the migrants
3. The immigration policy cost: this is reflected in c." tougher immigration policy raises the cost of migration directly as well as indirectly through the cost of acquiring characteristics necessary to gain admission"[5.1].
Thus the probability of migration decision that an individual, i, will migrate from country y to x mi is:
mi= prob(wxi - wyi - Zi - c>0)or mi= prob(v>0),v=wxi - wyi - Zi - c
Summing over all individuals in source country y, they will make decision if :
ux - uy - ui - c>0
And the emigration rate x is

Where Φ is the standard normal distribution function.
The effects of relative income in this model: There are at least three causes of a higher migration rate in terms of relative income. A higher mean income in the destination country, or a lower mean income in the source country would increase the migration rate. Suppose that the UK government reduces the tax rate for all the workers (leaving the tax rate in the source countries unchanged), then the relative income between the destination and source countries will increase and thus will increase the immigration rate. It also implied that a lower mean of migration costs will increase the migration rate as well.
The effects of income inequality in this model: The effects of changes in income distribution depend on the sign of the numerator (-ux + uy + ui + c) and denominator σv with respect to σx and σy.
TABLE 5.1
summary of migration rate when changes in income inequality
| ux > uy + ui + c | ux<uy + ui + c | |
|---|---|---|
| σx<σy | ΔM/Δσx >0 | ΔM/Δσx <0 |
| σx>σy | ΔM/Δσx <0 | ΔM/Δσx >0 |
In Table 5.1 for the four possible cases in migration rate when change income inequality.
In the case where σx<σy and ux > uy + ui + c

Wx is the earning function in destination country.
Wy is the earning function in source country.
W'x is the earning function in destination country after increasing income inequality
W'y is the earning function in source country plus uz and c
We begin with the intersection D formed by the earning functions Wx in destination country and Wy in source countries. The destination country has a relatively lower slope as this case is supposed that σ x<σy. It means that the destination country has a lower inequality in income distribution. Now we are going to introduce the costs into earning function in source country. This shifts the earning function up to W'y and intersects at point E with corresponding skill S1. Workers with fewer than S1 Efficiency units earn more in UK and will want to move. The decision they made is called negative selection.
The second condition ux > uy + uz + c means that the destination country has sufficiently higher relative income adjusted for migration costs. It is also implied that the mean of income in destination country is greater than the mean of income in source country plus the costs. It is obvious that point A has the mean of income in destination country is higher the mean of income in source country plus the costs at point B with corresponding skills ![]() .
.
Suppose the UK is going to increase the income inequality. An income inequality increases, it only affects the slope of the earning function Wx, and it will not affect the distribution of skills. Thus the destination earnings function will rotate by the point A into W'x. We now can get a new intersection point E with corresponding skills S2. as workers are negatively-selected, they will immigrate to the UK if their skill levels are lower than S2.Therefore by comparing these with the distribution of skill level at S1 and S2, we can come to the conclusion that S1 is smaller than S2. Therefore, this will attract relatively skilled migrants from countries that were sufficiently poor and relative unequal. This could also be explained as the relatively skilled workers in the source countries will have a high return once they have migrated to the UK. Thus increasing inequality in the destination country will have a positive effect on the migration rate(ΔM/Δσx >0).
In the case where ux<uy + uz + c and σx>σy:

In this case, we begin with the intersection C formed by the earning functions Wx in the destination country and W'y in source countries. The destination country has a relatively high slope as σ x>σy. It means that the destination country has a high inequality in income distribution. Workers who have a skill level higher than S1 will migrate to the UK as they are better off in the UK.
The second condition ux<uy + uz +c means that the destination country does not have sufficiently high relative income adjusted for migration costs. It is also indicated that the mean of income in the destination country is lower than the mean of income in the source country plus the costs. We suppose that point A is where the mean of income in the source country plus the costs with correspondence skills  and this point is higher than B with the mean of income in destination country. Suppose the UK is going to increase the income inequality. An increase in income inequality only affects the slope of earnings function Wx and it will not affect the skills of distribution. Thus the destination earnings function will rotate by the point B into W'x.
We now can get a new intersection point D with corresponding skills S2. Workers with higher than S2 efficiency units earn more and will migrate to the UK. Compared with the distribution of skill levels at S1 and S2, we can come to the conclusion that S1 is smaller than S2. This implies that ΔM/Δσx >0. Thus as Hatton said : "If income in Britain (adjusted for immigration costs) is sufficiently low relative to, say, OECD countries then increasing inequality will increase migration from these provided the British inequality is greater"[5.2]
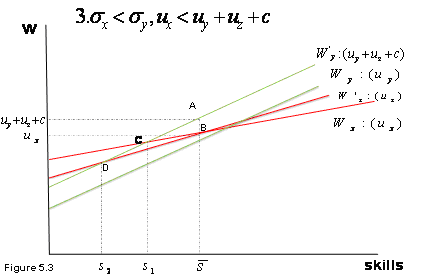

If neither of these cases holds, then growing inequality will deter immigration, as shown in Figure 5.3 and Figure 5.4. In the case ux < uy + ui + c , σx<σy, workers are negatively-selected, and as a result, all persons who have a skill level lower than S2 will migrate to the UK after increasing inequality. as the numbers of migrants at S2 is less than the migrants before UK increasing inequality at S1 , increasing inequality in UK will reduced the numbers of migrants. consequently,ΔM/Δσx <0
In the case ux > uy + ui + c, σx>σy , workers are postively selected, and as a result, all people who have a skill level higher than S2 will immigrate to the UK after increasing inequality. As the numbers of migrants at S2 is less than migrantsd before UK increasing inequality at S1 , increasing inequality in the UK will reduce the numbers of migrants. Consequently,ΔM/Δσx <0.
Hatton's Data Sources
The International Passenger Survey
Hatton's data on net immigration to the UK comes from the International Passenger Survey (IPS). The IPS randomly samples passengers entering and leaving Britain through the main airports, seaports and the Channel Tunnel. The Office of National Statistics (ONS) estimates that travellers on these routes make up about 90% of all travellers arriving and departing from the UK [5.3]
The IPS interviews a random sample of these passengers who are questioned about their travel purposes, and other matters such as fares and expenditure. The random sample covers about 1 in every 500 passengers, and Hatton points out that only a fraction of these are migrants.
The IPS defines an immigrant to the UK as a person who is arriving for at least a year, having previously spent a year overseas. An emigrant is a person who is leaving the UK for at least a year having spent at least a year in the country. We are interested in new immigration to the UK, which is simply worked out as immigration minus emigration.
There are obvious problems with this method of data collection. Because of the extremely small sample - and even smaller number of immigrants - the data will be subject to a sampling error. Moreover, the simple survey method of the IPS will not necessarily reflect the correct immigration figures to the UK. The people surveyed that were classified as migrants may have changed their plans and stayed in their destination country for less than a year. Similarly, others may have simply been planning to go on holiday and ended up settling in their destination country. Illegal immigrants would also avoid the survey or lie about their intentions.
Regardless of these problems, Hatton points out that the IPS provides the only comprehensive information on new immigration to the UK and proceeds to use the data in his model.
Source Country Data
The table below shows the IPS figures for net immigration to the UK, which Hatton uses as his data set. The negative numbers indicate net emigration, for example, Australia's net immigration figures are consistently negative over the years, indicating an outward flow of migrants from the UK to Australia.
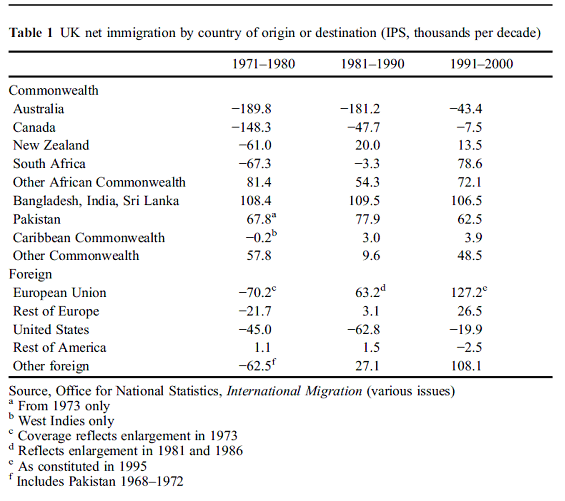
To create his data set, Hatton combines the EU and non EU country data to create a set of 13 countries or country groups. Hatton then looks at the net immigration data to the UK from each of these country groups over a period of 25 years, giving 325 (13*25) observations.
Explanatory Variables
In Hatton's regression model, he uses a number of explanatory variables to predict the effects that a change in these variables would have on net immigration to the UK. Some of the variables are lagged by one period (denoted by t-1) to properly capture their effects. For example, a sudden drop in UK GDP per capita would not immediately reduce immigration to the UK, it would take a while for immigration to adjust.
The explanatory variables are listed below:
Log Gross Domestic Product (GDP) per capita ratio (UK to foreign, t-1)
The GDP per capita of a country is used as an indicator of the wealth of a country. It is worked out by dividing the entire GDP of a country by the population of that country to give a figure for the average income per person.
If the GDP per capita of a foreign country was very low relative to the UK, then the GDP per capita ratio would be high. Therefore, intuitively, one would expect the log GDP per capita ratio to have a positive effect on net immigration to the UK. For example, if a person lived in relatively low income country, such as Pakistan, they would have an incentive to emigrate to the UK where the average income is higher.
Hatton's GDP data for the UK and the 13 source countries comes from the World Bank Global Development Network database [5.4] and are adjusted to the purchasing power parities of 1985. These figures are then divided by the population of the countries to generate GDP per capita.
Gini Coefficient
The GDP per capita, however, is not an adequate measure of the wealth of a country. For example, some oil rich countries have very large GDPs, yet their residents are extremely poor. The wealth of a country is concentrated in the hands of a select few. This is why the model takes into account the Gini Coefficient. This is a measure of income inequality within a country. The Gini Coefficient takes a numerical value between 0 and 1. A value of 0 means perfect equality, i.e. all people in the country have exactly the same income. A value of 1 means that just one person has all the wealth and the country is therefore highly unequal. [5.5]
Intuitively, the Gini Coefficient Ratio (UK to foreign) should also have a positive effect on net immigration to the UK. A large value for the ratio would mean that the source country is very unequal relative to the UK. People would therefore have more of an incentive to come to the UK.
Annual figures for the Gini Coefficient for all the countries was obtained from the Institute of Fiscal Studies.[5.6]
Foreign Born Population in UK, 1981
The stock of foreign born population in the UK is included, as it should have a significant effect on new immigration. Prospective migrants from the source countries would have a much higher incentive to settle in the UK if they already had friends and relatives living here.
This data is obtained from the Office of National Statistics (ONS) International Migration Report of 1983.
Dummy Variables
The Europe 1987-2000, 1996-2000, and Dummy 1998-2000 all reflect significant policy changes that should affect immigration to the UK. The two Europe dummies reflect the EU enlargements of 1986 and 1995 which allowed more people from Europe to settle in the UK. The third dummy reflects the loosening of immigration policy by the UK government in 1997.
Hatton's Results
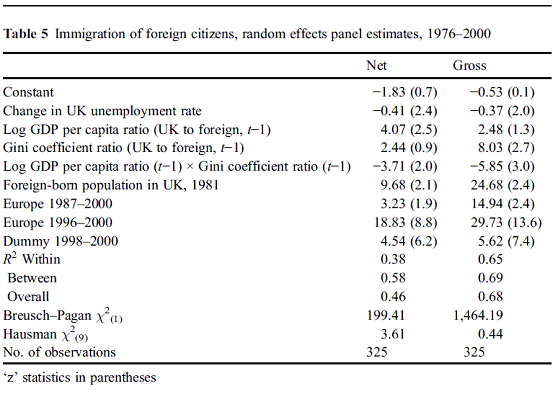
Overview of Table 5
Table 5 shows the results from the regression of all the explanatory variables on immigration to the UK. The coefficients from the regression are listed in the two right hand columns, with the related z statistics in brackets.
The inclusion of a z statistic is important as it shows if a result is statistically significant. In general, for a 95% significance level, any z statistic greater than 1.96 indicates that the coefficient is significant. For example, the z statistics on the Europe 1996 variable are very high (8.8 and 13.6 on net and gross immigration respectively). This shows that the European enlargement of 1995 had a highly significant effect on net immigration to the UK.
The R squared of a regression indicates how much variation in the dependent variable is explained by variation in the explanatory variables. Essentially it tells us how well the model "fits". The overall R squared on net immigration is 0.46, indicating that 46% of the variation in net immigration is explained by the variables in the model.
Predictions
Hatton works out the predicted change in immigration by multiplying the coefficients by the number of countries or country groups (13).
For example, a 1% increase in UK Unemployment Rate in period t would decrease immigration in the next period by about 5300 people. \-0.41*13=-5.3. This makes sense, as if rational people from other countries saw the economic situation worsening in the UK they would be less likely to want to immigrate here. The z statistic is 2.4 which is just significant.
The coefficient on log GDP per capita is larger and still significant. Using the same method, a 10% increase in GDP per capita ratio between the UK and the source country would increase net immigration by 5.3 thousand.
The Gini Coefficient Ratio, however, is statistically insignificant due to its low t statistic of 0.9. Hatton then introduces an interaction term (Log GDP per Capita ratio x Gini Coefficient) which turns out to be significant.
Therefore, holding all other things equal,
Change in net immigration = change in Log GDP ratio - (change in Log GDP ratio X change in Gini Coefficent ratio)
Which means that, although an increase in log GDP ratio will increase immigration, it will not increase as much as expected, because the interaction term is negative.
The interaction term (log GDP ratio x Gini Coefficient ratio) is introduced to allow the wealth of a source country to depend on income inequality. The negative sign indicates that the poorer the source country (and therefore the higher the GDP ratio), the smaller the effect of UK inequality.
This implies that, with an increase in UK inequality, immigration should increase more from more developed, i.e. richer countries.
Although the 1986 EU enlargement dummy doesn't have a very significant effect on immigration, the 1995 enlargement clearly had a significant effect. The model predicts that the enlargement increased net immigration to the UK from Europe by around 19,000. 1995 was the year that Austria, Finland and Sweden became members of the European Union, allowing millions of new EU citizens to freely settle in the UK.[5.7]
The loosening of UK immigration policy also had a significant effect, as expected. 1997 was the year in which Tony Blair and the Labour Party came into power in the UK, and had far more liberal views on immigration than the previous Conservative administration.[5.8] The most noticable change in the new Labour administration was the massive increase in work permits which "quadrupled between 1997 and 2007".[5.9]
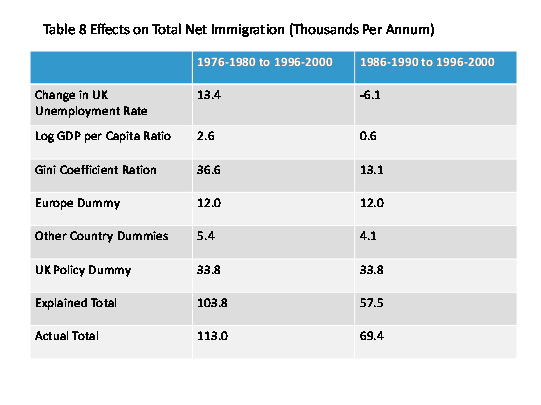
Table 8 Overview
In Table 8, Hatton applies the predicted coeffients from his model to the averages of the real data over two different time periods to see how much of his model explains the real data. The left hand column is concerned with the long run net immigration effects (1976-1980 to 1996-2000) while the right hand column describes the short run (1986-1990 to 1996-2000).
Applying the UK unemployment rate real figures to the coefficients in the model gives a long-term increase of 13.4 thousand immigrants due to falling unemployment and therefore more favourable labour market conditions in the long run.
Hatton points out that British GDP per capita experienced a slight increase over the years compared to the other 13 country groups. The model predicts that 2.6 thousand immigrants came into the UK in the long run, responding to the incentive of a higher income.
Clearly, the most significant variable in table 8 is the Gini Coefficient Ratio. Hatton states that the UK's gini coefficient rose from 0.247 to 0.323 during the time period. This is a dramatic increase in wage inequality within the UK, as on average, the other source countries only experienced a slight increase in their Gini coefficients. This increase in UK inequality is predicted to have increased net immigration to the UK by 36.6 thousand people. This is an interesting result, as it implies that prospective migrants are attracted to a country in which a lot of the wealth is concentrated in fewer hands. This could also indicate that higher skilled immigrants would want to settle in the UK in the hope of obtaining a job in one of the higher wage brackets.
The European enlargements added a predicted 12 thousand net immigrants to the UK, whilst the UK policy changes added 33.8 thousand. Both of these results are as expected. The EU enlargements significantly widened the pool of people who could freely enter and settle in the UK. The more liberal UK administration and its looser immigration policies also had the expected effect on net immigration.
The most interesting figures in Table 8 however, are the explained and actual totals. Hatton's model explains 103.8 thousand of the 113 thousand net immigrants to the UK over the 25 year period. This is more than 90% of the actual total. This implies that Hatton has captures almost all aspects of the causes of net immigration.
Other Theories
The best known early model for the analysis of migration is the typology constructed by Fairchild. He distinguished migration into:[6.1]
Invasion - The best example of this is the Visigoth of Rome.
Conquest - This is where the people of higher society take an aggressive post
Colonisation - This is when "a well established, progressive, and physically vigorous state" resolves "newly discovered or thinly settled countries."
Immigration - This is the self motivated, peaceful movement between countries that are at roughly at a similar phase of civilization.
He agrees with other migrant analysts saying that man is ubiquitously sedentary, and he will stay there unless is encouraged to move by a force. Other analysts say man migrates because of his desire to travel.
He defined four classes of migration: primitive, forced and impelled migration, free migration and mass migration.
Primitive migration is migration that is caused by an ecological push. This is not the movement of primitive peoples, but rather a movement associated with the incapability to cope with natural forces. This is usually undertaken by peoples with low levels of development. Most primitive migrants will be conservative. A conservative move preserves an accustomed way of life in new surroundings. These conservative migrations are not set by push and pull, but by the interaction of push and control. There are both manmade (e.g. Great Wall of China, Berlin Wall) and natural barriers (e.g. mountains or rainfall or lack of rainfall).
Forced migration and impelled migration are similar but it is useful to divide the two as they have slight differences. Forced migration is a compulsory transfer of a group of people, usually by a government, whereas in impelled migration, migrants retain some ability to decide whether to move or not. It is difficult to draw a boundary line at which the choice becomes nominal. An example is the treatment of Jews by the Nazis. Between the years of 1933 - 1938, they encouraged Jews to emigrate by means of Anti-Semitic acts and laws, whereas the later policy (c. 1938 - 1945) included herding Jews into cattle trains and transporting them to the camps.
Free migration is where the will of the migrants is the decisive element. They are individual movements for economic betterment. There are a lot of risks with migration that are difficult to calculate, those that did emigrate were people that would be considered adventurer or intellectuals that were stimulated by their ideals Mass migration is moving as a group without being fully knowledgeable on an individual basis of what to expect in the new country. Free migration is not common because there are not that many people in the world that are very motivated to achieve originality. However, those that do leave trails that others will follow. Migration, effectively becomes a style or pattern in collective behaviour. The main cause of emigration is emigration that has happened before.
Neoclassical economics: macro (Lewis 1954, Ranis and Fei, 1961; Harris and Todaro, 1970; Todaro 1976)[6.2]
This can be compared with free migration as above. This theory was made initially to explain rationale for labour migration in the face of economic development. Geographical differences in the supply and demand for labour, just like internal migration, causes international migration. Where there is a large supply of labour relative to capital, there will be a low equilibrium market wage. Where there is a low supply of labour relative to capital, there will be a high equilibrium market wage. This wage difference makes workers from the low wage country want to move to the high wage country. Because of this movement, the labour supply in the low wage country falls and the equilibrium wage increases, whereas in the high wage country, the labour supply increases and the wage falls. This leads to an international wage differential that includes the cost of international movement, financial costs and psychic.
This explanation has shaped the way governments make immigration policy. Here is the perspective:
"1. The international migration of workers is caused by differences in wage rates between countries.
2. The elimination of wage differentials will end the movement of labor, and migration will not occur in the absence of such differentials.
3. International flows of human capital respond to differences in the rate of return to human capital, which may be different from the overall wage rate, yielding a distinct pattern of migration that may be opposite that of unskilled workers.
4. Labor markets are the primary mechanisms by which international flows of labor are induced; other kinds of markets do not have important effects on international migration.
5. The way for governments to control migration flows is to regulate or influence labor markets in sending and/or receiving countries."(Sjaasted, 1962; Todaro, 1969, 1976,1989; Todaro and Marzuko, 1987)
This corresponds with the microeconomic model of individual choice. In this model, rational individuals decide to migrate, when a cost-benefit calculation allows them to anticipate a positive return, frequently monetary, from migrating. People migrate where their skills can be used the most. However, before this, they must undertake the costs that go with migrating, such as travelling, maintenance costs, the cost of learning new language and culture, and the cost that old social ties will be cut. This is similar to the human capital model discussed earlier. Potential migrants perform a cost-benefit analysis by calculating their discounted net returns, and multiply it by the probability of getting a job there, and will migrate to where these "expected destination earnings" will be the highest. These are subtracted from the expected earnings in the original country, and the differences are summed from 0 to n, with a discount rate which is equal to the higher utility of money earned now rather than later. The following equation summarizes this: 
- ER(0) is the expected net return to migration just before departure at time 0
- t is time
- P1(t) is the probability of being kicked out of the destination area (1.0 for legal migrants and <1.0 for illegal migrants)
- P2(t) is the probability of employment at the new destination
- Yd(t) is earnings if in work at destination
- P3(t) is the probability of employment in original destination
- Yo(t) is earnings if employed in the original destination
- r is the discount factorC(0) is the sum total of the costs of movement (which includes psychological costs).
The new economics of migration
This new approach focuses on the theory that decisions of migration are not done by individuals, but rather related people, such as families. Income maximisation is not the only goal; there is also the aim of minimising risk. Households can spread the allocation of resources. For example, some of the household member could go to work in the local economy, whereas others can go to work in foreign labour markets. If the activities done in the economy do not bring the sufficient income, the migrant remittances can provide the support the household needs.
In developing areas, there is risk to household income as there as limited private insurance markets or governmental schemes to protect them, whereas in developed countries, they do exist. These market failures in the developing countries create an argument for international movement.
An example of this would be unemployment insurance. In developed countries, you would find a benefits scheme to compensate workers that have been made redundant (e.g. in the UK, there is the Job Seekers Allowance), or are physically unable to work. In developing countries, these unemployment or disability programs are not present. Therefore people from families in developing countries will send over workers in order to insure themselves. However, other developed countries do have laws about eligibility for benefits.
The hypotheses and propositions of "new economics" of migration is quite different to that of neo-classical theory. These are the policies:
"1. Families, households, or other culturally defined units of production and consumption are the appropriate units of analysis for migration research, not the autonomous individual.
2. A wage differential is not a necessary condition for international migration to occur; households may have strong incentives to diversify risks through transnational movement even in the absence of wage differentials.
3. International migration and local employment or local production are not mutually exclusive possibilities. Indeed, there are strong incentives for households to engage in both migration and local activities. In fact, an increase in the returns to local economic activities may heighten the attractiveness of migration as a means of overcoming capital and risk constraints on investing in those activities. Thus, economic development within sending regions need not reduce the pressures for international migration.
4. International movement does not necessarily stop when wage differentials have been eliminated across national boundaries. Incentives for migration may continue to exist if other markets within sending countries are absent, imperfect, or in disequilibria.
5. The same expected gain in income will not have the same effect on the probability of migration for households located at different points in the income distribution, or among those located in communities with different income distributions.
6. Governments can influence migration rates not only through policies that influence labor markets, but also through those that shape insurance markets, capital markets, and futures markets. Government insurance programs, particularly unemployment insurance, can significantly affect the incentives for international movement.
7. Government policies and economic changes that shape income distributions will change the relative deprivation of some households and thus alter their incentives to migrate.
8. Government policies and economic changes that affect the distribution of income will influence international migration independent of their effects on mean income. In fact, government policies that produce a higher mean income in migrant-sending areas may increase migration if relatively poor households do not share in the income gain. Conversely, policies may reduce migration if relatively rich households do not share in the income gain."
Sociological theories
Immanuel Kant (1795) argued that all 'world citizens' should have a right to free movement.[6.3] This is because he believes that humans have a universal ownership of the Earth. This 'right' has been very violated, because of the nation-state system, which decides who enters and who leaves.
Early sociologists, such as Comte and Durkheim described migration as a peaceful and evolutionary process. [6.4] However after this, migration has been seen as a more violent process. Marx said, "great masses of men were suddenly and forcibly torn from their means of subsistence, and hurled on to the labour market as free, unprotected and rightless proletarians." [6.5] This is describing when peasants are displaced from their habitat, due to industrial purposes.
After this, other sociological studies discovered the level at which modern capitalism needed 'free' and 'unfree' labour to function successfully and profitably. An example of unfree labour is Western African slavery. An example of free labour is a guest worker (gastarbeiter) in post World War II. Germany did this to keep away from social wage costs, deny settlement and deny the civic right to the foreign workers that the national citizens had. The national citizens, on the other hand were led to believe that these foreign workers were stealing their jobs and resources. Ultimately, however, these policies were unsustainable because employers kept workers with high productivity, and the migrants manages to settle there in the long term, advancing their human rights.
Another approach is the 'deterministic approach'. Ravenstein (1885) analysed the relationship between distance and propensity to move. [6.6] Ravenstein's seven laws of migration appear in most sociological overviews. Ravensteins seven laws of migration are :
1) Most migrants only proceed a short distance, and toward centers of absorption.
2) As migrants move toward absorption centers, they leave "gaps" that are filled up by migrants from more remote districts, creating migration flows that reach to "the most remote corner of the kingdom."
3) The process of dispersion is inverse to that of absorption.
4) Each main current of migration produces a compensating counter-current.
5) Migrants proceeding long distances generally go by preference to one of the great centers of commerce or industry.
6) The natives of towns are less migratory than those of the rural parts of the country.
7) Within their own country, females are more migratory than males, but males are more migratory over long distances.
It is important to note that some of these have been adapted slightly. This was an empirical approach. An instrumental account can provide explanations for decisions to be made about migration. For two alternative decisions, one will choose the decision for which the perceived value is greater. The meso-level approach highlights how decisions about migration tend to be coordinated in groups, rather than individuals. There is a social-relational framework that is symbolized by social ties. Social ties have a value. They are a requirement for social capital. Francis Fukuyama defines social capital as "shared norms or values that promote social cooperation, instantiated in actual social relationships" [6.7] This may be information on various jobs in other countries or advice on travelling to destination countries. There are two kinds of networks:
1. Social networks that are based on ties that relate the household to the community
2. Professional, ethnic or religious ties.
These organisations take a lot of time to develop, and vary at different geographical locations. Mabogunje (1970)[6.8]
and Tos and Klinar. [6.9]
(1976) used systems approaches, which make an interdependence between sending and receiving areas. This splits up migration movements in to four different identifiable components which were economic, social, technological and environmental.
Hoffman-Nowotny [6.10]
(1981) created a theory whose foundations were the relation between power and prestige in society. Inequalities in the sending country create 'structural tendencies', which cause animosity. A solution of this is to migrate to another country. However, this may simply transfer the 'under-casting', and the receiving country must look for new ways to accommodate and integrate the immigrants.
Myron Weiner (1987) said "there maybe as many refugees in the world as there are people who migrated in response to employment opportunities" [6.11] Zolberg (1989) states that refugees cannot fend for themselves in the face of violence. [6.12]Violence today is much more destructive than it was in the past, because governments and their opponents have more powerful weapons. Also, it will reduce agricultural production below the subsistence level. Because of better access to roads and means of movement such as bicycles, poor peasants can become refugees. Refugees are a consequence of the formation of new states, and a by-product from disagreements over the social order in new and old states.
Policy overview
1)UK immigration in the past
The growth of asylum seeker applications contributed to a new growth of immigration to the UK. But the rise in asylum seeker arrivals has seen a rise in racial tensions. Fifty years after the start of mass immigration to the UK, questions are still being asked about whether or not the UK can become a multi-ethnic society at ease with itself
2)UK Immigration and asylum Latest Statistics
This covers immigration from Eastern Europe, asylum applications and removals and voluntary departures. Thefigures show that migration from the EU eight accession Countries fell to 118,000 in 2008, from 209,000 in 2007.'The fall in net-migration is further proof that migrants come to the UK for short periods of time, work, contribute to the economy and return home.[7.1]
Over the past two decades there has been a rising tide of applications for asylum in Europe and other developed regionsAs table 1 shows, the level and trend in applications varies widely across the EU-15.While some countries such as Austria, Denmark, France and Sweden experienced a downward trend in applications between the late 1980s and the late 1990s, for others such as Belgium, the Netherlands,Ireland and the UK the trend is sharply upwards.)[7.2]
Table 1. Asylum applications to the EU-15 by destination country and region of origin (thousands)[7.3]

Integrating asylum policy: 2004-2010
The UK Government's scheme concentrated on the extraterritorial processing of asylum claims. Asylum seekers arriving in the EU would be transferred to a Regional Protection Area outside the EU (in a transit country or in the region of origin) where their refugee status would be determined (UK Government 2003))[7.3]. Aside from the practicalities of such a scheme, the proposal was widely seen as burden-shifting rather than burden-sharing and it was subsequently dropped.
A model of asylum policy
asylum seekers who gain refugee status are admitted on the grounds of the benefit to them of escaping
persecution rather than on grounds of social or economic benefits to the host population. Public opinion is generally favourable towards genuine refugees
1)The basic framework
These elements can be captured in a two-country model following in the spirit of Hatton and Williamson (2004))[7.4]. The net benefit from refugees accruing to the citizens in each of the refugee-receiving countries can be represented as:
W1= V1(γ1,γ2 )-c1γ1 ;W2=V2(γ2,γ1)-cγ2 (1)
where country 1's net valuation W1 depends on the number that are accepted as refugees in country 1, γ1 , and the number that are received in country 2, γ2, minus country 1's cost of refugees, cγ1. It is assumed that V1 and V2 are concave functions of γ1 and γ2, reflecting diminishing marginal utility for (or diminishing tolerance of) refugees and that each country has a constant cost per refugee. The number of refugees accepted in each country depends on overall 'demand' for refugee places, on the generosity of asylum policy, and on deflection effects from policy in the other country:
γ1=A× [sγ1+ß(sγ1-(1-s)γ2)]
γ2=A× [(1-s)γ2+ß((1-s)γ2-sγ1)] (2)
where A is total 'demand' for asylum, 0 < s < 1 represents the share of asylum seekers with a preference for country 1 and (1 - s) is the share prr As s seferring country 2. γ1 is an index of the 'generosity' of country 1's asylum policy; the greater is γ1 more asylum seekers country 1 admits for a given level of demand. The parameter 0 <β<1 captures the deflection of asylum seekers from one country to another resulting from policy differences weighted by country shares. Thus, for a given level of overall demand for
asylum, country 1 accepts more asylum seekers as refugees the more generous is country 1's policy (the greater is, γ1 ) and the less generous is that of country 2 (the smaller is γ2 ).
In this setup the number of refugees accepted by both countries combined, R, does not depend on the deflection
effects, but only on total demand and the weighted average of policy
R=γ1+γ2 =A× [sγ1-(1-s)γ2] (3)
2)Social optima
The set of efficient solutions are the policy choices γ1and γ2 that maximise V1(γ1,γ2) - cγ1 subject to V2(γ2, γ1) - cγ2 ≥K. Choosing different values of K traces out the 'welfare possibility frontier' for these two countries. Equivalently, these efficient choices maximise V1(γ1,γ 2) - cγ1 +μ[ V2(γ2, γ1) - cγ2], where μ is the weight given to country 2's preferences relative to those of country 1. If they are given equal weight, then μ = 1. The weights may reflect political bargaining between the two countries.From the first order conditions, an efficient outcome for country 1 must satisfy the following:
∂V1/ ∂γ1 =c1-μ(∂V2 /∂ γ1 ) (4)
∂V1/∂γ1 is the marginal benefit to country 1 of an additional refugee there, and ∂V2 /∂γ₁ is the marginal benefit to country 2 of an additional refugee in country 1. Thus efficiency requires that ∂V1/∂γ1< c1for ∂V2 / ∂γ1 > 0 and μ >0.
Country 1 should set its policy parameter γ1 so that its own marginal benefit of a refugee is less than the refugee's marginal cost, because of the externality or public good spillover effect (∂ V2 / ∂γ1 ) of its policy choice on the welfare of country 2. Equation (4) and its counterpart for country 2
determine the optimal number of refugees in each country that results from setting the policy parameters γ1 and γ2 to maximise social welfare. If asylum seekers have a preference for country 1 (s > 0.5) and the countries are otherwise identical, then country 1 must set a tougher policy than country 2: (γ1 < γ2 ). Similarly if country 1 has higher costs per refugee, then if the countries are otherwise identical it will set a tougher policy.
the opportunity to improve overall welfare by financial burden-sharing through an enhanced European Refuge Fund was missed during Stage .As a result, policy will probably remain too tough. If this is the case, then there is an argument for pursuing both forms of burden-sharing: redirecting refugees to get the distribution right, and financial burden-sharing to raise the overall intake to the optimum level
policy conclusion
Provided that current asylum seeker flows probably exceed those that would be optimal even under more cooperative policies, a radical relaxation of asylum policies seems unlikely. The resources should be invested in efforts to help displaced populations when they return home and to create conditions that make civil wars less likely .
The newcomers most likely to leave the UK are highly skilled immigrants who are "super mobile" due to the low barriers for their entry to many countries .The IPPR report recommended that the Government take more active steps to keep migrants from leaving.For example,changes to the country's points based system,implementation of retention schemes,and simplified visa extension requirements and tax incentives.)[7.5]
Current Government Points-based system for skilled foreign workers has been implemented to more selectively accept immigrants and high skilled migrants to stay longer. Regulations on Applicants of Tier 1 ,Tier 2 and Tier 5 would be significant role to lure entrants and attain more benefits from them to contribute for UK economy
See Also
References
[2.1.1] .Hatton, T.J (2005) - Explaining trends in UK immigration, Journal of Population Economics, Vol 18; 4
[2.1.2] National Archives: http://www.nationalarchives.gov.uk/pathways/citizenship/brave_new_world/immigration.htm Assessed: 16/12/09
[2.1.3] Office of National Statistics
[2.1.4] International passeger survey/ONS
[2.1.5] Office of National Statistics
[2.1.6] British Broadcasting Commission - http://news.bbc.co.uk/1/hi/uk_politics/7737490.stm
[2.1.7] The labour market performance of recent migrants - Ken Clark and Stephen Drinkwater Oxford Review of Economic Policy, Vol. 24, Issue 3, pp. 496-517, 2008
[2.2.1]Russel Haque,"Migrants in the UK: A descriptive analysis of their characteristics and labour market performance, based on the Labour Force Survey",december 2002,From research studies of Department for Work and Pensions ,Home Office
[2.2.2]Salt J(2004), International migration and the United Kingdom : report of the United kingdom SOPEMI correspondent to OECD
[3.1] .George J. Borjas "Labour Economics," Fourth Edition: Geographic Migration as a Human Capital Investment, pages 322-340
[3.2] The Labour Market Effects of Immigration- http://www.ucl.ac.uk/~uctpb21/Cpapers/ecoj_1036.pdf
[4.1] .George J. Borjas "Self-Selection and the Earnings of Immigrants,"_American Economic Review_, September 1987, pp. 531-553. Reprinted in Labor Economics, Volume 4, edited by Orley C. Ashenfelter and Kevin F. Hallock, Edward Elgar Publishing, 1995, pp. 351-373; reprinted in Labor Economics: Worth Series in Outstanding Contributions, edited by Orley Ashenfelter, Worth Publishers, 1999, pp. 305-335.
[4.2] .George J. Borjas (2008), Labor Economics: Fifth Revised Edition, McGraw-Hill p.343
[5.1] .Timothy J. Hatton,Explaining trends in UK immigration,Received: 11 February 2004 / Accepted: 6 December 2004 /Published online: 22 November 2005 © Springer-Verlag 2005 p729
[5.2] .Timothy J. Hatton,Explaining trends in UK immigration,Received: 11 February 2004 / Accepted: 6 December 2004 /Published online: 22 November 2005 © Springer-Verlag 2005 p729
[5.3] National Office of Statistics: http://www.statistics.gov.uk/ssd/surveys/international_passenger_survey.asp]
[5.4] World Bank Development Database: http://web.worldbank.org/WBSITE/EXTERNAL/DATASTATISTICS/0,,contentMDK:20535285~menuPK:1192694~pagePK:64133150~piPK:64133175~theSitePK:239419,00.html
[5.5] Economics Expert: Source:http://www.economicexpert.com/a/Gini:coefficient.htm
[5.6] Institute of Fiscal Studies: Source:http://www.ifs.org.uk/.
[5.7] http://actrav.itcilo.org/actrav-english/telearn/global/ilo/blokit/eularge.htm
[5.8] http://www.migrationinformation.org/Feature/display.cfm?ID=600.
[5.9] http://www.migrationwatchuk.org/briefingpaper/document/167.
[6.1] A General Typology of Migration , William Petersen, American Sociological Review, Vol. 23, No. 3 (Jun., 1958), pp. 256-266
[6.2] Theories of International Migration: A Review and Appraisal Author(s): Douglas S. Massey, Joaquin Arango, Graeme Hugo, Ali Kouaouci, Adela Pellegrino, J. Edward Taylor Source: Population and Development Review, Vol. 19, No. 3 (Sep., 1993), pp. 431-466
[6.3] Immanuel Kant, Perpetual Peace: A Philosophical Sketch (1795)
[6.4] [Sociology of Migration|www.learningmigration.com/files/projectinfo/8/Sociology%2520of%2520Migration%2520.doc+comte+and+durkheim+migrationj&cd=1&hl=en&ct=clnk&gl=uk]
[6.5]Marx, Capital, Volume I, Part VIII, Chapter 26
[6.6] Ernest George Ravenstein: The Laws of Migration, 1885. By John Corbett
[6.7] "Social Capital and Development: The Coming Agenda", Francis Fukuyama definition of social capital
[6.8]Mabogunje, A. K. (1970). Systems approach to a theory of rural-urban migration.Geographical Analysis, 11(10), 1-18.
[6.9] TOS, N. and SXINAR, P. (1976) 'A Systems Model for Migration Research: Yugoslav Workers in the Federal Republic of Germany *, in Richmond, A. H. (ed.) International Migration andAdaptation in the Modern World, Toronto, ISA Research Committee on Migration.
[6.10] Hoffman-Nowotny, H-J. (1981) "A Sociological Approach Toward a General Theory ofMigration" in Kritz M M, Keely C.B, Tomasi S. M . eds. Global Trends inMigration: Theory and Research
[6.11] Weiner, W. 1987. International Emigration and the Third World. In population in an Interacting World. Edited by W. Alonso, Cambridge: HarvardUniversity Press. Pp. 173-200
[6.12] Author(s): Aristide R. Zolberg Source: International Migration Review, Vol. 23, No. 3, Special Silver Anniversary Issue: International Migration an Assessment for the 90's (Autumn, 1989), pp. 403-430
[7.1]2009 Annual immigration statistics for 2008 and quarterly immigration figures for April to June 2009 were published by the Home Office
[7.2]Timothy J. EUROPEAN ASYLUM POLICY,Hatton,NATIONAL INSTITUTE ECONOMIC REVIEW No. 194 OCTOBER 2005
[7.3]United Nations High Commission for Refugees (2001a), Asylum Applications in Industrialised Countries: 1980-1999, Geneva:UNHCR.;(2004), Statistical Yearbook, 2003, Geneva: UNHCR
[7.4]UK Government (2003), 'New international approaches to asylum processing and protection', accessed as 'New Vision for Refugees' from ProAsyl website:[http://www.proasyl.de/texte/europe/union/2003/UK_NewVision.pdf]
[7.5]Hatton, T. J. and Williamson J. G. (2004), 'Refugees, asylum seekers and policy in Europe', NBER Working Paper 10680, Boston,NBER.\
[7.6]The study,'Re-migration trends among Britain's immigrants'By British think tank Institute for Public Policy Research (IPPR),2009